HORSEFLY MESA - 9/20/2011 to 10/17/2012
LOCATION DETAILS |
Latitude: |
N 38° 13.566’ or N 38° 13’ 33.96" |
Longitude: |
W 107° 55.492’ or W 107° 55’ 29.52" |
Survey Meridian: |
Colorado, New Mexico Meridian |
Township: |
46 N |
Range: |
10 W |
Section: |
24 |
Elevation: |
9,009 feet (2,746 m) |
Datum: |
WGS 84 |
Tower Type: |
NRG tilt-up tower |
Tower Height: |
20 m (65.6 feet) |
Vane Offset (deg): |
+80° |
Direction Basis: |
True North |
Mag. Declination: |
10° 7' E, changing by 7' W/yr |
Wind Explorer S/N: |
0665 |
Site No.: |
3800 |
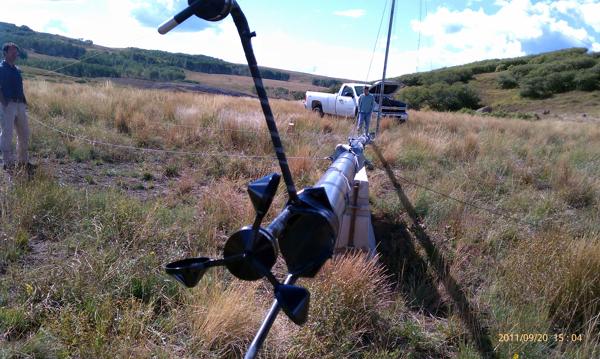 Install Team (from right): Andrew Costinett (CSU), Will Clapsadl (Ouray County Facilities), and Mike Kostrzewa (taking picture). Install Team (from right): Andrew Costinett (CSU), Will Clapsadl (Ouray County Facilities), and Mike Kostrzewa (taking picture).
DATA DETAILS
September 20, 2011 through October 17, 2012:
The anemometer tower was installed on September 20, 2011 and removed on October 17, 2012. The site was located on Horsefly Mesa in the Cornerstone development overlooking the Uncomphagre Valley. The site was located in a pasture on a saddle between two hills to the NW and the SE. This spot was believed to have good access to wind, particularly from the SW.
All data was collected using an NRG #40 Calibrated Anemometer and NRG #200 Wind Vane. The certification for the anemometer is as follows:
NRG #40C Calibrated Anemometer |
Model No. |
1900 |
Serial No. |
1795-00088445 |
Calibration Date |
11/6/08 8:00 a.m. |
Slope |
0.760 m/s per Hz |
Offset |
0.36 m/s |
This equipment fed into an NRG Wind Explorer data logger. All data plugs were sent to the Colorado ALP at Colorado State University for analysis. The data plug files and text versions of these files are given below.
It is important to note that these are the raw files without any compensation for offset.
Using this data, an analysis of the wind resource report was developed using Windographer 2.4.6. For this data an offset of +80° was applied to the wind vane data. For this report, a validation analysis was performed on the data. This data was filtered two ways:
- Any wind speed data where the wind speed was less than 0.5 m/s and the temperature was below 0°C for 3 hours.
- Any wind direction data where the wind direction varied by less than 3 degrees for 8 hours or more was deleted.
Windographer was then used to add in synthetic data to these intervals with suspect data. A summary report, the combined data files (with and without the validation analysis), and the Windographer files (with and without the validation analysis) are given below:
Final Wind Resource Summary
Highlights of the final wind resource at this site are shown below:
Data Properties |
Variable |
Data Set Starts: |
9/20/2011 16:20 MST |
Height above ground (m) |
20 |
Data Set Ends: |
10/17/2012 07:50 |
10-min. mean wind speed (m/s) |
4.812 |
Data Set Duration: |
13 months |
10-min median wind speed (m/s) |
4.350 |
Length of Time Step: |
10 minutes |
10-min min. wind speed (m/s) |
0.36 |
Elevation: |
9,009 feet (2,746 m) |
10-min max wind speed (m/s) |
23.16 |
Mean air density (kg/m³): |
0.933 |
10-min standard deviation (m/s) |
3.470 |
Wind Power Coefficients |
Weibull k |
1.305 |
Power Density at 50m: |
218 W/m² |
Weibull c (m/s) |
5.181 |
Wind Power Class: |
2 (Marginal) |
Mean power density (W/m²) |
150 |
Wind Shear Coefficients |
Mean energy content (kWh/m²/yr) |
1,312 |
Power Law Exponent: |
0.126 |
Mean turbulence intensity |
0.222 |
Surface Roughness: |
0.01 m |
Energy pattern factor |
2.881 |
Roughness Class: |
0.78 |
Total data elements |
169,623 |
Roughness Description: |
Rough Pasture |
Flagged wind speed data elements |
872 |
Flagged direction data elements |
3,017 |
Missing data elements |
9 |
Data recovery rate (%) |
100.00% |
Note: The wind power density and wind power class at 50m are projections of the data from 20m. A surface roughness of 0.01 meters was assumed for this projection. This is the surface roughness for a rough pasture. This value was then used this to calculate the roughness class and the power law exponent shown above. |
/Data_Plug_2012_1017/Horsefly_Mesa_Wind_Shear_600.png)
Vertical Wind Shear, Height (m) vs Mean Wind Speed (m/s)
|
/Data_Plug_2012_1017/Horsefly_Mesa_Wind_Frequency_Rose_600.png)
Wind Frequency Rose at 20 meters
|
/Data_Plug_2012_1017/Horsefly_Mesa_Wind_Energy_Rose_600.png)
Wind Energy Rose at 20 meters
|
/Data_Plug_2012_1017/Horsefly_Mesa_Mean_Diurnal_Profile_600.png)
Daily Wind Speed Profile at 20m, Hourly Mean Wind Speed (m/s) vs. Hour of the Day
|
/Data_Plug_2012_1017/Horsefly_Mesa_Monthly_Wind_Speed_Profile_600.png)
Seasonal Wind Speed Profile at 20m, Monthly Mean Wind Speed (m/s) vs. Month
|
| |
/Data_Plug_2012_1017/Horsefly_Mesa_PDF_600.png)
Probability Distribution Function at 20m: Frequency (%) vs. Wind Speed (m/s) |
Windographer was used to match up the wind at this site with the performance curves of some common turbines of various sizes and various heights. The table below shows the results. For the larger turbines, the tower height was increased to account for the larger turbine blades - the wind resource was extrapolated to these higher heights. Keep in mind that the larger and the higher the turbine, the better the wind and the greater the output. But of course, as the tower heights and turbine sizes increase so does the cost.
Turbine |
Rotor
Diameter
meters |
Rotor
Power
kW |
Hub
Height
meters |
Hub
Height
Wind
Speed
m/s |
Time
At
Zero
Output
percent |
Time
At
Rated
Output
percent |
Average
Net
Power
Output
kW |
Average
Net
Energy
Output
kWh/yr |
Average
Net
Capacity
Factor
% |
Bergey Excel-R |
6.7 |
7.5 |
20 |
4.81 |
39.2 |
3.1 |
1.3 |
11,700 |
17.8 |
Bergey Excel-S |
6.7 |
10 |
20 |
4.81 |
27.8 |
1.6 |
1.5 |
12,700 |
14.5 |
Bergey XL.1 |
2.5 |
1 |
20 |
4.81 |
16.0 |
4.3 |
0.2 |
1,800 |
20.2 |
Southwest Skystream 3.7 |
3.7 |
1.8 |
20 |
4.81 |
36.2 |
0.0 |
0.4 |
3,100 |
19.6 |
Southwest Whisper 500 |
4.5 |
3 |
20 |
4.81 |
39.2 |
3.8 |
0.7 |
5,700 |
21.8 |
Northern Power NW 100/21 |
21 |
100 |
37 |
5.20 |
33.7 |
0.0 |
16.6 |
145,600 |
16.6 |
GE 1.5s |
70.5 |
1,500 |
64.7 |
5.58 |
39.4 |
3.4 |
245.9 |
2,154,500 |
16.4 |
GE 2.5xl |
100 |
2,500 |
75 |
5.68 |
33.9 |
3.7 |
542.0 |
4,748,200 |
21.7 |
GE 3.0s |
90 |
3,000 |
70 |
5.63 |
40.4 |
1.0 |
416.1 |
3,644,800 |
13.9 |
Vestas V90 - 1.8 MW |
90 |
1,800 |
80 |
5.73 |
33.7 |
4.0 |
442.7 |
3,878,500 |
24.6 |
Vestas V90 - 2.0 MW |
90 |
2,000 |
80 |
5.73 |
33.7 |
3.9 |
466.8 |
4,089,400 |
23.3 |
Vestas V90 - 3.0 MW 109.4 dB(A) |
90 |
3,000 |
80 |
5.73 |
31.4 |
0.6 |
525.4 |
4,602,100 |
17.5 |
Vestas V100 - 1.8 MW |
100 |
1,800 |
80 |
5.73 |
31.7 |
5.4 |
517.4 |
4,532,300 |
28.7 |
Vestas V100 - 2.0 MW |
100 |
2,000 |
80 |
5.73 |
32.8 |
1.2 |
528.5 |
4,629,800 |
26.4 |
Vestas V100 - 2.6 MW |
100 |
2,600 |
75 |
5.68 |
32.9 |
1.5 |
568.5 |
4,980,200 |
21.9 |
Vestas V112 - 3.0 MW |
112 |
3,075 |
84 |
5.76 |
33.1 |
4.0 |
750.4 |
6,573,200 |
24.4 |
IMPORTANT: No turbine losses are included in the power, energy, and capacity factor values in the table. Typically, turbine losses can be 5-20% to account for maintenance downtime, icing/soiling and losses from other turbines in a wind farm. Users wanting to be conservative in the performance projections should multiply the power, energy, and capacity values by (1- % losses) to account for these losses.
|

