JOES - 7/20/2011 to 10/13/2012
LOCATION DETAILS |
Latitude: |
N 39° 38.387’ or N 39° 38’ 23.22" |
Longitude: |
W 102° 37.532’or W 102° 37’31.92" |
Survey Meridian: |
Colorado, Sixth Principal Meridian |
Township: |
5 S |
Range: |
47 W |
Section: |
3 |
Elevation (ft.): |
4,203 ft (1,281 m) |
Datum: |
WGS 84 |
Tower Type: |
Earth Turbines Tilt-Up |
Tower Height: |
34 m (112 ft) |
Vane Offset (deg): |
+132° (built into raw data) |
Direction Basis: |
True North |
Mag. Declination: |
7° 36' E, changing by 8' W/yr |
Symphonie S/N: |
309020086 |
Site No.: |
9302 |
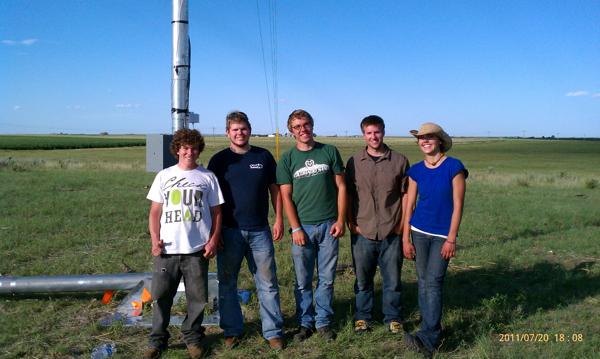
CSU ALP Install Team (from left): Michael Lichtbach, Scott Little, Christian Knapp, Mark Goudreault, Jacqueline Hess, and Mike Kostrzewa (taking picture).
DATA DETAILS
July 20, 2011 to October 13, 2012:
The anemometer tower was installed on July 20, 2011 and removed on October 13, 2012. The site was located on a small rise in a pasture in Yuma County. This spot has good access to wind from all locations.
Data was collected using three (3) NRG #40C Calibrated Anemometers and one (1) NRG #200P Wind Vane, as follows:
- Anemometers
- 34 m (111.5 feet) (Anemometer A) heading 5 ° on an NRG 60" standard boom
- 34 m (111.5 feet) (Anemometer B) heading 262° on an NRG 60" standard boom
- 20 m (65.6 feet) heading 314° on an NRG 60" standard boom
- Wind Vane
- 35.3 m (116 feet) heading 312° on an NRG 60" standard boom with the null point facing toward the tower
There was also a temperature sensor at a height of 1.8 m (6 feet) on a 6" boom.
All sensors fed into an NRG Symphonie data logger. The certifications for the anemometers are as follows:
NRG #40C Calibrated Anemometers |
Anem. No. |
1 (A - North) |
2 (B - South) |
3 |
Height |
34 m |
34 m |
20 m |
Model No. |
1900 |
1900 |
1900 |
Serial No. |
1795-00164536 |
1795-00152535 |
1795-00164535 |
Calibration Date |
11/24/10 1:23 p.m. |
4/30/10 4:39 p.m. |
11/24/10 1:13 p.m. |
Slope |
0.758 m/s per Hz |
0.757 m/s per Hz |
0.760 m/s per Hz |
Offset |
0.40 m/s |
0.40 m/s |
0.39 m/s |
The data logger generated wind reports for each day. Using the Symphonie Data Retriever software, each day's data was complied into one large data file. A zipped file that contains all of the NRG data files and a text version of the aggregate data for all days are given below:
It is important to note that the wind direction data included in these files has already been adjusted for offset at the data logger.
The temperature sensor, the wind vane, and the anemometer at the 20m level were incorrectly connected to the data logger when initially installed. The connections were correctly wired on September 14, 2011 at 15:10 hours.
An analysis of the wind resource at this site was developed using Windographer 2.4.6 and a data quality analysis was performed on the data. This data was flagged for icing in two ways:
- Any wind speed data (from any anemometer) where the wind speed was less than 0.5 m/s at a temperature less than 0°C for 3 hours or more was flagged and removed from the wind resource analysis calculations
- Any wind direction data (from any wind vane) where the wind direction varied by less than 2 degrees at a temperature less than 3°C for 3 hours or more was flagged and removed from the wind resource analysis calculations.
The summary report, the combined data files (with and without the data quality analysis), and the Windographer files (with and without the data quality analysis) are given below:
Final Wind Resource Summary
Highlights of the final wind resource analysis at this site are shown below:
Data Properties |
Data Set Starts: |
7/20/2011 16:30 MDT |
Data Set Ends: |
10/13/2012 10:00 |
Data Set Duration: |
15 months |
Length of Time Step: |
10 minutes |
Elevation: |
4,203 ft (1,281 m) |
Mean air density (kg/m³): |
1.067 |
Wind Power Coefficients |
Power Density at 50m: |
374 W/m² |
Wind Power Class: |
3 (Fair) |
Wind Shear Coefficients |
Power Law Exponent: |
0.231 |
Surface Roughness: |
0.339 m |
Roughness Class: |
3.01 |
Roughness Description: |
Many trees |
Variable |
Height above ground |
|
|
20m (66 ft.) |
10-min. Mean wind speed (m/s) |
6.653 |
6.724 |
6.038 |
10-min Median wind speed (m/s) |
6.510 |
6.640 |
5.800 |
10-min Standard deviation (m/s) |
3.087 |
3.185 |
2.948 |
10-min Min. wind speed (m/s) |
0.40 |
0.40 |
0.34 |
10-min Max wind speed (m/s) |
29.76 |
29.42 |
27.50 |
Weibull k |
2.246 |
2.178 |
2.125 |
Weibull c (m/s) |
7.492 |
7.559 |
6.802 |
Mean power density (W/m²) |
270 |
282 |
214 |
Mean energy content (kWh/m²/yr) |
2,366 |
2,475 |
1,874 |
Mean turbulence intensity |
0.134 |
0.131 |
0.153 |
Energy pattern factor |
1.721 |
1.746 |
1.830 |
Possible records |
64,903 |
64,903 |
64,903 |
Valid records |
64,899 |
64,899 |
56,846 |
Missing records |
4 |
4 |
8,057 |
Data recovery rate (%) |
99.99 |
99.99 |
87.59 |
/Data_Card_2012_1013/Joes_Vertical_Wind_Shear_Profile_600.png)
Vertical Wind Shear, Height (m) vs Mean Wind Speed (m/s)
|
/Data_Card_2012_1013/Joes_Wind_Frequency_Rose_600.png)
Wind Frequency Rose at 34 meters
|
/Data_Card_2012_1013/Joes_Wind_Energy_Rose_600.png)
Wind Energy Rose at 34 meters
|
/Data_Card_2012_1013/Joes_Daily_Wind_Speed_Profile_600.png)
Daily Wind Speed Profile, Hourly Mean Wind Speed (m/s) vs. Hour of the Day
|
/Data_Card_2012_1013/Joes_Seasonal_Wind_Speed_Profile_600.png)
Seasonal Wind Speed Profile, Monthly Mean Wind Speed (m/s) vs. Month
|
/Data_Card_2012_1013/Joes_PDF_34A_600.png)
Probability Distribution Function at 34m - Sensor A: Frequency (%) vs. Wind Speed
|
/Data_Card_2012_1013/Joes_PDF_34B_600.png)
Probability Distribution Function at 34m - Sensor B: Frequency (%) vs. Wind Speed
|
/Data_Card_2012_1013/Joes_PDF_20_600.png)
Probability Distribution Function at 20m: Frequency (%) vs. Wind Speed
|
Windographer was used to match up the wind at this site with the performance curves of some common turbines of various sizes and various heights. The table below shows the results. For the larger turbines, the tower height was increased to account for the larger turbine blades - the wind resource was extrapolated to these higher heights. Keep in mind that the larger and the higher the turbine, the better the wind and the greater the output. But of course, as the tower heights and turbine sizes increase so does the cost.
Keep in mind too that listing a particular turbine doesn't imply an endorsement - not does it imply that installing a particular turbine model is feasible or recommended for a particular site. For consistency, the larger turbines are included even at sites that where they may not be practical so that one can compare the relative production of different sites.
Turbine |
Rotor
Diameter
meters |
Rotor
Power
kW |
Hub
Height
meters |
Hub
Height
Wind
Speed
m/s |
Time
At
Zero
Output
percent |
Time
At
Rated
Output
percent |
Average
Net
Power
Output
kW |
Average
Net
Energy
Output
kWh/yr |
Average
Net
Capacity
Factor
% |
Bergey Excel-R |
6.7 |
7.5 |
34 |
6.69 |
12.1 |
4.8 |
2.4 |
20,900 |
31.8 |
Bergey Excel-S |
6.7 |
10 |
34 |
6.69 |
5.3 |
2.8 |
2.6 |
22,500 |
25.6 |
Bergey XL.1 |
2.5 |
1 |
34 |
6.69 |
1.9 |
6.8 |
0.4 |
3,100 |
35.7 |
Southwest Skystream 3.7 |
3.7 |
1.8 |
34 |
6.69 |
10.9 |
0.0 |
0.7 |
5,800 |
36.6 |
Southwest Whisper 500 |
4.5 |
3 |
34 |
6.69 |
12.0 |
5.8 |
1.1 |
10,000 |
38.1 |
Northen Power NW100 21m |
21 |
100 |
37 |
6.84 |
10.5 |
0.0 |
27.8 |
243,900 |
27.8 |
GE 1.5s |
70.5 |
1,500 |
64.7 |
7.96 |
12.3 |
6.7 |
501.3 |
4,391,600 |
33.4 |
GE 2.5xl |
100 |
2,500 |
75 |
8.30 |
8.1 |
9.5 |
1,091.7 |
9,563,200 |
43.7 |
GE 3.0s |
90 |
3,000 |
70 |
8.14 |
12.9 |
1.7 |
874.9 |
7,664,200 |
29.2 |
Vestas V90 - 1.8 MW |
90 |
1,800 |
80 |
8.46 |
8.0 |
11.3 |
884.4 |
7,747,500 |
49.1 |
Vestas V90 - 2.0 MW |
90 |
2,000 |
80 |
8.46 |
8.0 |
10.9 |
945.4 |
8,281,800 |
47.3 |
Vestas V90 - 3.0 MW 109.4 dB(A) |
90 |
3,000 |
80 |
8.46 |
7.1 |
1.5 |
1,113.1 |
9,751,000 |
37.1 |
Vestas V100 - 1.8 MW |
100 |
1,800 |
80 |
8.46 |
7.5 |
15.3 |
987.2 |
8,648,100 |
54.8 |
Vestas V100 - 2.0 MW |
100 |
2,000 |
80 |
8.46 |
7.6 |
3.2 |
1,033.1 |
9,050,400 |
51.7 |
Vestas V100 - 2.6 MW |
100 |
2,600 |
75 |
8.30 |
7.6 |
3.5 |
1,119.5 |
9,807,200 |
43.1 |
Vestas V112 - 3.0 MW |
112 |
3,075 |
84 |
8.58 |
7.7 |
12.1 |
1,510.6 |
13,232,800 |
49.1 |
IMPORTANT: No turbine losses are included in the power, energy, and capacity factor values in the table. Typically, turbine losses can be 5-20% to account for maintenance downtime, icing/soiling and losses from other turbines in a wind farm. Users wanting to be conservative in the performance projections should multiply the power, energy, and capacity values by (1- % losses) to account for these losses.
|

