CSU MOUNTAIN CAMPUS - 8/13/2010 to 9/18/2015
LOCATION DETAILS |
Latitude: |
N 40° 34.139’ or N 40° 34’ 8" |
Longitude: |
W 105° 35.292’or W 106° 35’ 18" |
Survey Meridian: |
Colorado, Sixth Principal Meridian |
Township: |
7N |
Range: |
73W |
Section: |
16 |
Elevation (ft.): |
2,767.6 m ( 9,080 ft) |
Datum: |
WGS 84 |
Tower Type: |
Earth Turbines Tilt-Up |
Tower Height: |
34 m (111.5 feet) |
Vane Offset (deg): |
+52° (built into raw data) |
Direction Basis: |
Magnetic North |
Mag. Declination: |
9° 25' E, changing by 8' W/yr |
Symphonie S/N: |
309020390 |
Site No.: |
4005 |
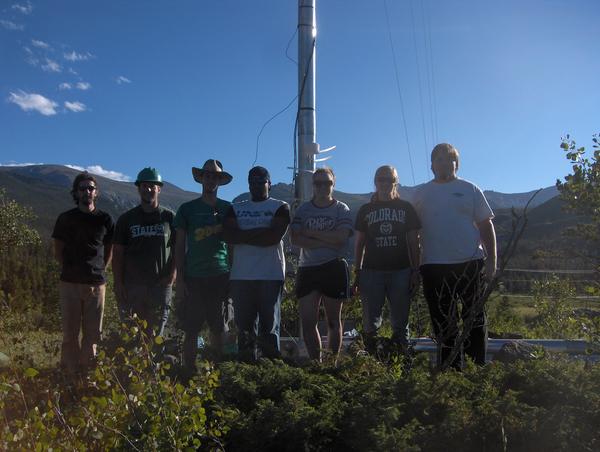
CSU ALP Install Team (from left): Kevin Gosselin, Mark Goudreault, Eric Rasbach, Jake Renquist, Sarah Bass, Laura Ruff, John Purcell, and Mike Kostrzewa (taking picture). Not shown: Daniel Fink, Todd MacDonald, and Hunter Vassau
DATA DETAILS
August 13, 2010 to September 18, 2015:
The anemometer tower was installed on August 13, 2010. The site is located on CSU's Mountain Campus, on a small ridge above and across the road from the ropes course, near the entrance to the campus. This spot appears to be one of the best spots in the valley and the ridge appears to be an ideal location to install a wind turbine. The terrain around the site contains shrub oaks, small aspens, small pines and a few larger trees nearby. Two power transmission lines lie within 150 feet of the site.
Data is collected using three (3) NRG #40C Calibrated Anemometers and one (1) NRG #200P Wind Vane, as follows:
- Anemometers
- 33.8 m (111 feet) heading 200° on an NRG 60" standard boom
- 33.8 m (111 feet) heading 290° on an NRG 60" standard boom
- 20.0 m (65.6 feet) heading 230° on an NRG 60" standard boom
- Wind Vane
- 34.7 m (114 feet) heading 250° on an NRG 60" standard boom with the null point facing toward the tower
There is also a temperature sensor at a height of 1.8 m (6 feet) on a 6" boom.
All sensors feed into an NRG Symphonie data logger. The certifications for the anemometers are as follows:
NRG #40C Calibrated Anemometers |
Anem. No. |
1 |
2 |
3 |
Height |
33.8 m |
33.8 m |
20 m |
Model No. |
1900 |
1900 |
1900 |
Serial No. |
1795-00087848 |
1795-00087807 |
1795-00087819 |
Calibration Date |
10/31/2008 4:47 p.m. |
10/31/2008 4:47 p.m. |
10/31/08 7:30 p.m. |
Slope |
0.756 m/s per Hz |
0.758 m/s per Hz |
0.758 m/s per Hz |
Offset |
0.39 m/s |
0.34 m/s |
0.34 m/s |
The data logger generated wind reports for each day. A zipped file that contains all of the NRG data files for all days are given below:
It is important to note that the wind direction data included in these files has already been adjusted for offset at the data logger.
From this data, an analysis of the wind resource report was developed for entire data collection period using Windographer 3.3.10. No offset was applied to the wind vane data as none was needed. Since the data set contains data for two or more wind speed sensors at different heights above the ground, Windographer considered the wind shear relationship between different wind speed sensors to synthesize missing data for those wind speed sensors. A best fit using the power law profile was chosen to synthesize the data. Once the wind shear relation was chosen, a daily influence on the wind shear profile was considered so that in each time step where the wind speed is known at one height but not at a different height, Windographer estimated the unknown wind speed based on the best-fit wind shear profile for the appropriate hour of the day.
For this analysis, a data quality analysis was performed on the data. This data was flagged for icing in two ways:
- Any wind speed data where the wind speed was less than 1 m/s for 3 hours or more when the temperature was less than 2°C was deleted.
- Any wind direction data where the wind direction varied by less than 3 degrees over 3 hours when the temperature was less than 2°C was deleted.
Windographer was then used to add in synthetic data to these intervals with suspect data. The summary report, the combined data files (with and without the data quality analysis), and the Windographer files (with and without the data quality analysis) are given below:
Interim Wind Resource Summary
Highlights of the wind resource to date at this site are shown below:
Data Properties |
Data Set Starts: |
8/14/2010 00:00 MST |
Data Set Ends: |
9/19/2015 00:00 |
Data Set Duration: |
5.1 years |
Length of Time Step: |
10 minutes |
Elevation: |
2,767 m (9,078 ft.) |
Mean air density (kg/m³): |
0.906 |
Wind Power Coefficients |
Power Density at 50m: |
354 W/m² |
Wind Power Class: |
3 (Fair) |
Wind Shear Coefficients |
Power Law Exponent: |
0.181 |
Surface Roughness: |
0.103 m |
Roughness Class: |
2.02 |
Roughness Description: |
Few trees |
Variable |
Height above ground |
|
|
20m (65.6 ft.) |
10-min. Mean wind speed (m/s) |
5.986 |
5.967 |
5.449 |
10-min Median wind speed (m/s) |
4.92 |
4.92 |
4.47 |
10-min Min. wind speed (m/s) |
0.39 |
0.30 |
0.30 |
10-min Max wind speed (m/s) |
31.83 |
32.10 |
30.18 |
10-min Standard deviation (m/s) |
4.370 |
4.347 |
4.096 |
Weibull k |
1.390 |
1.401 |
1.348 |
Weibull c (m/s) |
6.564 |
6.558 |
5.949 |
Mean power density (W/m²) |
297 |
293 |
234 |
Mean energy content (kWh/m²/yr) |
2,602 |
2,565 |
2,051 |
Mean turbulence intensity |
0.26 |
0.26 |
0.29 |
Energy pattern factor |
3.023 |
3.008 |
3.158 |
Possible records |
268,128 |
268,128 |
268,128 |
Valid records |
268,121 |
268,121 |
267,012 |
Missing records |
7 |
7 |
1,116 |
Data recovery rate (%) |
100 |
100 |
99.6 |
/Data_Card_2015_0103/CSU_Mountain_Campus_Wind_Shear.png)
Vertical Wind Shear, Height (m) vs Mean Wind Speed (m/s)
|
/Data_Card_2015_0103/CSU_Mountain_Campus_Wind_Energy_Rose.png)
Wind Energy Rose at 33.8 meters
|
/Data_Card_2015_0103/CSU_Mountain_Campus_Wind_Frequency_Rose.png)
Wind Frequency Rose at 33.8 meters
|
/Data_Card_2015_0103/CSU_Mountain_Campus_Diurnal_Wind_Speed_Profile.png)
Daily Wind Speed Profile, Hourly Mean Wind Speed (m/s) vs. Hour of the Day
|
/Data_Card_2015_0103/CSU_Mountain_Campus_Seasonal_Wind_Speed.png)
Seasonal Wind Speed Profile, Monthly Mean Wind Speed (m/s) vs. Month
|
/Data_Card_2015_0103/CSU_Mountain_Campus_PDF_34A.png)
Probability Distribution Function at 33.8m - Sensor A: Frequency (%) vs. Wind Speed
|
/Data_Card_2015_0103/CSU_Mountain_Campus_PDF_34B.png)
Probability Distribution Function at 33.8m - Sensor B: Frequency (%) vs. Wind Speed
|
/Data_Card_2015_0103/CSU_Mountain_Campus_PDF_20m.png)
Probability Distribution Function at 20m: Frequency (%) vs. Wind Speed |
Windographer was used to match up the wind at this site with the performance curves of some common turbines of various sizes and various heights. The table below shows the results. For the larger turbines, the tower height was increased to account for the larger turbine blades - the wind resource was extrapolated to these higher heights. Keep in mind that the larger and the higher the turbine, the better the wind and the greater the output. But of course, as the tower heights and turbine sizes increase so does the cost.
Keep in mind too that listing a particular turbine doesn't imply an endorsement - not does it imply that installing a particular turbine model is feasible or recommended for a particular site. For consistency, the larger turbines are included even at sites that where they may not be practical so that one can compare the relative production of different sites.
Turbine |
Rotor
Diameter
meters |
Rotor
Power
kW |
Hub
Height
meters |
Hub
Height
Wind
Speed
m/s |
Time
At
Zero
Output
percent |
Time
At
Rated
Output
percent |
Average
Net
Power
Output
kW |
Average
Net
Energy
Output
kWh/yr |
Average
Net
Capacity
Factor
% |
| Southwest AIR X - 45 ft tower |
|
|
13.7 |
5.08 |
43.6 |
0.0 |
0 |
194 |
5.5 |
| Bergey XL.1 - 100 ft tower |
|
|
30.0 |
5.84 |
9.0 |
10.5 |
0.3 |
2,500 |
28.0 |
| Southwest Skystream 3.7 - 45 foot tower |
|
|
13.7 |
5.08 |
37.2 |
4.2 |
0.4 |
3,600 |
23.1 |
| Southwest Whisper 500 - 42 ft tower |
|
|
12.8 |
5.02 |
41.4 |
6.2 |
0.7 |
6,100 |
23.3 |
| Endurance S-250 - 100 ft tower |
|
|
30.0 |
5.84 |
41.9 |
0.0 |
0.9 |
7,900 |
18.0 |
| Bergey Excel-R - 100 ft tower |
|
|
30.0 |
5.84 |
34.6 |
7.1 |
1.8 |
15,800 |
24.0 |
| Bergey Excel-S - 100 ft tower |
|
|
30.0 |
5.84 |
21.7 |
4.9 |
2.1 |
18,500 |
21.2 |
| Endurance E-3120 - 100 ft tower |
|
|
30.0 |
5.84 |
30.9 |
0.0 |
13.6 |
119,300 |
24.8 |
| Northern Power 100-21 - 121 ft tower |
|
|
37.0 |
6.07 |
17.2 |
0.0 |
20.2 |
177,400 |
20.3 |
| GE 1.5-77 - 213 ft tower |
77 |
1,500 |
65.0 |
6.77 |
26.0 |
6.5 |
424.8 |
3,720,800 |
28.3 |
| Vestas V100 - 262 ft tower |
100 |
2,000 |
80.0 |
7.07 |
23.2 |
3.9 |
662.4 |
5,802,300 |
33.1 |
IMPORTANT: No turbine losses are included in the power, energy, and capacity factor values in the table. Typically, turbine losses can be 5-20% to account for maintenance downtime, icing/soiling and losses from other turbines in a wind farm. Users wanting to be conservative in the performance projections should multiply the power, energy, and capacity values by (1- % losses) to account for these losses.
ANALYST'S NOTES
1. The tower was install over two days: August 11 and August 13, 2010. The install team on August 11 included 11 (!) people: Jake Renquist, Todd MacDonald, Dan Fink, Eric Rasbach, Laura Ruff, Sarah Bass, John Purcell, Kevin Gosselin, Hunter Vassau, Mark Goudreault, and Mike Kostrzewa. The team arrived onsite at 10:30 and assembled the baseplate and the tower. The battery was removed from the CSU Motor Pool truck and used to power the winch. The winch anchor and the upwind anchor were tested with the winch connected to another truck and a dynamometer attached to the truck hook. The upwind anchor tested to 3,800 lbs and the winch tested to 5,000 lbs. The anchors were installed by the CSU Mountain Campus facilities staff the previous day or so. The anchors move but appear to be heavily secured with rocks or other bracing. After assembling the tower, the lifting guys were attached and the tower was lifted to horizontal to check lifting capacity and to make sure the tower cleared the nearby power line. After this lift, it was noticed that the wrong box of sensors was placed in the truck so the team decided to shut own for the day at about 14:30 and return to CSU. On August 13, the team arrived onsite at 11:00 and began installing the sensors. The tower was ready to lift at 13:00 until it was noticed that the team had forgotten to install the stabilizing ears on the baseplate. The ears were then installed and the tower lift started at 14:00. The lift was slow as there were a number of snags that had to be cleared as the tower was lifted. The lift was stopped frequently to let out tension in the guy wires as the tower was raised. The tower was lifted into place and secured at 18:00 and the team was offsite by 17:00.
2. Mike Kostrzewa visited the tower again on August 20, 2010 and downloaded the data from the original data card (No. 0390). From the data, several error were noted in the Symphonie logger configuration:
a) There was no temperature data because the temperature sensor had been inadvertently configured as a wind vane in Channel 9.
b) The Site Number was inadvertently set at 4005, not at 4050. Also, the site latitude was stated as N 040° 34.189', not the correct value of N 040° 34.139'
c) The 20m anemometer was actually wired into Channel 2, not into Channel 3 as the original configuration showed.
Rather than rewiring the 20m anemometer, the Symphonie configuration was changed to correct all of the errors above.
3. Mike Kostrzewa visited the site on September 30, 2010 arriving onsite at 16:05 MDT. The SD data card No. 0390) was removed from the logger at 16:08 (15:08 in the Symphonie data logger), the data was downloaded, and the card was returned to the data logger. The first wind resource assessment was completed and posted online the next day, October 1, 2010.
4. Pat Rastall visited the site on December 21, 2010 arriving at about 11:15. Pat replaced the existing card (No. 0390) with a new card (No. 1002). Mike Kostrzewa picked up Card No. 0390 from Pat when he returned. Data was downloaded from the card and the wind resource assessment was completed and posted online that night.
5. Jacque Hess visited the site on March 17, 2011 arriving at about 14:09. Jacque replaced Card No. 1002 with a new card (No. 0390) and Mike Kostrzewa picked up the card from Jacque when she returned. The wind resource assessment was completed and posted on March 21, 2011. A Windographer template was generated for this data to switch Channels 2 and 3 automatically when new data is appended to an existing data set.
6. Mike Kostrzewa visited the site on May 19, 2011 arriving at about 17:12 (16:01 by the logger time) and t replaced Card No. 0390 with a new card (No. 0383). Data was downloaded from Card No. 0390 and the wind resource assessment was completed and posted on May 25, 2011.
7. Mike Kostrzewa and Andy Kostrzewa visited the site on July 7, 2011 arriving onsite at about 17:50 (logger time). The existing data card (No. 0383) was replaced with Card No. 0393 and the wind resource assessment was completed on July 8, 2011 but not posted online.
8. Mike Kostrzewa visited the site on October 9, 2011 arriving at about 17:40 (16:28 by the logger time). The existing data card (No. 0393) was replaced with Card No. 1004 and the guy wires were adjusted to take out some of the slack and straighten the tower. The wind resource assessment was completed and posted online on October 11, 2011.
9. Mike Kostrzewa visited the site on November 21, 2011 arriving at about 10:50 (logger time). The existing data card (No. 1004) was replaced with Card No. 0390. The wind resource assessment was completed and posted online on December 18, 2011.
10. Mike Kostrzewa visited the site on October 19, 2012 arriving at about 11:50 (logger time). The data was downloaded from the SD card and the card was returned to the data logger. The wind resource assessment was completed and posted online on March 19, 2012.
11. Mike Kostrzewa visited the site on August 8, 2013 arriving at about about 14:50 logger time. The data was downloaded from the SD card and the card was returned to the data logger. No data or wind resource assessment was posted online.
12. Mike Kostrzewa visited the site on November 20, 2013 arriving at about 9:50 (logger time). The data was downloaded from the existing data card (No. 0390) and a new card (No. 0393) was installed in the data logger along with a new pair of C batteries. The wind resource assessment was completed and posted online on November 27, 2013.
13. Mike Kostrzewa visited the site on July 21, 2014 arriving at about 7:30 (logger time). The data was downloaded from the SD card and the card was returned to the data logger. The wind resource assessment was completed on July 30, 2014 but not posted online.
14. Mike and Wendy Kostrzewa visited the site on November 1, 2014 arriving at about 15:00 (logger time). The data was downloaded from the SD card and the card was returned to the data logger. The wind resource assessment was completed and posted online on December 22, 2015.
15. Mike and Wendy Kostrzewa visited the site on January 3, 2016 arriving at about 11:25 MST. The logger was found to be non-responsive because the batteries were dead. New C batteries were installed and a new card (No. 0390) was inserted and reformatted to be able to store 664 days of data. The data from Card No. 0393 was downloaded and contained 672 days of data through September 18, 2015 when the card became full. Thus, no data was collected from September 19, 2015 through January 2, 2016. The wind resource assessment was completed for all data through September 18, 2015 and posted online on January 12, 2016.
|

