KERSEY (70 Ranch) - 8/10/2010 to 8/10/2011
LOCATION DETAILS |
Latitude: |
N 40° 23.258’ or N 40° 23’ 15" |
Longitude: |
W 104° 23.920’or W 104° 23’ 55" |
Survey Meridian: |
Colorado, Sixth Principal Meridian |
Township: |
5N |
Range: |
63 W |
Section: |
23 |
Elevation: |
4,656 ft (1,419.1 m) |
Datum: |
WGS 84 |
Tower Type: |
Earth Turbines Tilt-Up |
Tower Height: |
34 m (111.5 feet) |
Vane Offset (deg): |
+28° (built into raw data) |
Direction Basis: |
Magnetic North |
Mag. Declination: |
8° 46' E, changing by 8' W/yr |
Symphonie S/N: |
309020391 |
Site No.: |
0404 |
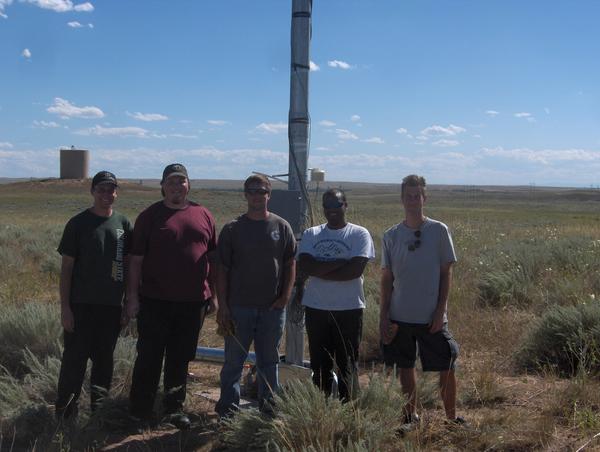
CSU ALP Install Team (from left): Daniel Fink, John Purcell, Mark Goudreault, Jake Renquist, Eric Rasbach, and Mike Kostrzewa (taking picture).
DATA DETAILS
August 10, 2010 to August 10, 2011:
The anemometer tower was installed on August 10, 2010 and removed exactly one year later on August 10, 2011. The site was located in a field about 4.8 miles north of U.S. Highway 34 and 8.6 miles due east of Kersey on the 70 Ranch. The terrain was generally flat or slightly rolling in all directions, but the exact site was on a slight rise above all of the terrain within about 1,000 feet of the site. A power transmission line lies about 1/4 mile east of the site.
Data was collected using three (3) NRG #40C Calibrated Anemometers and one (1) NRG #200P Wind Vane, as follows:
- Anemometers
- 33.8 m (111 feet) on an NRG 60" standard boom
- 33.8 m (111 feet) on an NRG 60" standard boom
- 20.0 m (65.6 feet) on an NRG 60" standard boom
- Wind Vane
- 34.7 m (114 feet) heading 166° on an NRG 13" Z-mast with the null point facing toward the tower
There was also a temperature sensor at a height of 1.8 m (6 feet) on a 6" boom.
All sensors fed into an NRG Symphonie data logger. The certifications for the anemometers are as follows:
NRG #40C Calibrated Anemometers |
Anem. No. |
1 |
2 |
3 |
Height |
33.8 m |
33.8 m |
20 m |
Model No. |
1900 |
1900 |
1900 |
Serial No. |
1795-00109728 |
1795-00087808 |
1795-00087836 |
Calibration Date |
5/4/2009 3:12:53 p.m. |
10/31/08 5:39:04 a.m. |
10/31/08 10:44:30 a.m. |
Slope |
0.759 m/s per Hz |
0.755 m/s per Hz |
0.760 m/s per Hz |
Offset |
0.30 m/s |
0.40 m/s |
0.33 m/s |
The data logger generated wind reports for each day. Using the Symphonie Data Retriever software, each day's data was complied into one large data file. A zipped file that contains all of the NRG data files and a text version of the aggregate data for all days are given below:
It is important to note that the wind direction data included in these files has already been adjusted for offset at the data logger.
Using this data, an analysis of the wind resource report was developed using Windographer 1.49. For this report, a validation analysis was performed on the data. This data was filtered two ways:
- Any wind speed data where the wind speed was less than 1 m/s for 3 hours or more when the temperature was less than 2°C was deleted.
- Any wind direction data where the wind direction varied by less than 3 degrees over 3 hours when the temperature was less than 2°C was deleted.
Windographer was then used to add in synthetic data to these intervals with suspect data. During the period considered, there were no intervals of suspect data, so no synthetic data were added.
The final summary report, the combined data files (with and without the data quality analysis), and the Windographer files (with and without the data quality analysis) are given below:
However, when the tower was removed, the crew noticed that one of the three cups on the 20m anemometer was damaged. The cup could have been damaged by the guy wires as the tower was lowered because the anemometer was directly in alignment with the lifting guys. But the cup could have also been damaged before lowering the tower - it's a little hard to notice this type of damage from 20 m below.
So we looked at the data so see if there was any indication of prior damage. The 20 m anemometer throughout the entire data collection period has recorded significantly reduced wind speed than the 34 m anemometers, but starting on June 11, 2011 at 18:00, the sensor looked to have longer periods of low or no wind speed. This affected the power law exponent because it is a curve-fit with the 20m and 34m wind speed data. The graph below shows how the power law exponent varied over the entire data collection period:
/Data_Card_2011_0810/Kersey_70_Ranch_Power_Law_Exponent_600.png)
The change in the power law exponent occurs in early June, perhaps as early as June 8 but certainly by June 11. For this reason, we prepared another wind resource assessment after removing the 20m wind speed data from 18:00 on June 11 through the remaining two months of the data collection period. The revised final summary report, the combined data file (with the data quality analysis), and the Windographer file (with the data quality analysis) with the bad data removed are given below:
The tables and graphs below show the results both with and without this data removed.
But even with this consideration, the final result is that the wind at this site is a Class 1 wind at 34m and would likely still be a Class 1 wind at 50m.
Final Wind Resource Summary
The anemometer tower was removed from the site on August 10, 2011. Highlights of the wind resource at this site for the entire monitoring period are shown below:
Data Properties - WITH BAD DATA REMOVED |
Data Set Starts: |
8/10/2010 14:30 MST |
Data Set Ends: |
8/10/2011 09:00 |
Data Set Duration: |
12 months |
Length of Time Step: |
10 minutes |
Elevation: |
1,419 m (4,656 ft.) |
Mean air density (kg/m³): |
1.050 |
Wind Power Coefficients |
Power Density at 50m: |
176 W/m² |
Wind Power Class: |
1 (Poor) |
Wind Shear Coefficients |
Power Law Exponent: |
0.164 |
Surface Roughness: |
0.0588 m |
Roughness Class: |
1.56 |
Roughness Description: |
Crops |
Data Properties - WITH BAD DATA INCLUDED |
Data Set Starts: |
8/10/2010 14:30 MST |
Data Set Ends: |
8/10/2011 09:00 |
Data Set Duration: |
12 months |
Length of Time Step: |
10 minutes |
Elevation: |
1,419 m (4,656 ft.) |
Mean air density (kg/m³): |
1.050 |
Wind Power Coefficients |
Power Density at 50m: |
184 W/m² |
Wind Power Class: |
1 (Poor) |
Wind Shear Coefficients |
Power Law Exponent: |
0.215 |
Surface Roughness: |
0.248 m |
Roughness Class: |
2.75 |
Roughness Description: |
Many Trees |
RESULTS - WITH BAD DATA REMOVED |
Height above ground |
|
|
20m (66 ft.) |
10-min. Mean wind speed (m/s) |
4.783 |
4.797 |
4.439 |
10-min Median wind speed (m/s) |
4.000 |
4.050 |
3.700 |
10-min Min. wind speed (m/s) |
0.144 |
0.144 |
0.131 |
10-min Max wind speed (m/s) |
22.59 |
20.98 |
21.27 |
10-min Standard deviation (m/s) |
3.354 |
3.089 |
3.131 |
Weibull k |
1.467 |
1.628 |
1.468 |
Weibull c (m/s) |
5.291 |
5.374 |
4.915 |
Mean power density (W/m²) |
164 |
147 |
133 |
Mean energy content (kWh/m²/yr) |
1,437 |
1,284 |
1,169 |
Mean turbulence intensity |
0.219 |
0.189 |
0.222 |
Energy pattern factor |
2.873 |
2.543 |
2.914 |
1-hr autocorrelation coefficient |
0.806 |
0.801 |
0.820 |
Diurnal pattern strength |
0.253 |
0.241 |
0.259 |
Hour of peak wind speed |
18 |
18 |
17 |
Possible records |
52,527 |
52,527 |
44,373 |
Valid records |
52,379 |
52,457 |
43,941 |
Missing records |
148 |
70 |
8,586 |
Data recovery rate (%) |
99.72 |
99.87 |
83.65 |
Total data elements |
1,050,540 |
Suspect/missing elements |
8,804 |
Data completeness (%) |
99.1 |
RESULTS - WITH BAD DATA INCLUDED |
Height above ground |
|
|
20m (66 ft.) |
10-min. Mean wind speed (m/s) |
4.783 |
4.797 |
4.278 |
10-min Median wind speed (m/s) |
4.000 |
4.050 |
3.610 |
10-min Min. wind speed (m/s) |
0.144 |
0.144 |
0.131 |
10-min Max wind speed (m/s) |
22.59 |
20.98 |
21.27 |
10-min Standard deviation (m/s) |
3.354 |
3.089 |
3.102 |
Weibull k |
1.467 |
1.628 |
1.398 |
Weibull c (m/s) |
5.291 |
5.374 |
4.694 |
Mean power density (W/m²) |
164 |
147 |
123 |
Mean energy content (kWh/m²/yr) |
1,437 |
1,284 |
1,081 |
Mean turbulence intensity |
0.219 |
0.189 |
0.231 |
Energy pattern factor |
2.873 |
2.543 |
3.024 |
1-hr autocorrelation coefficient |
0.806 |
0.801 |
0.803 |
Diurnal pattern strength |
0.253 |
0.241 |
0.291 |
Hour of peak wind speed |
18 |
18 |
17 |
Possible records |
52,527 |
52,527 |
52,527 |
Valid records |
52,379 |
52,457 |
52,314 |
Missing records |
148 |
70 |
213 |
Data recovery rate (%) |
99.72 |
99.87 |
99.59 |
Total data elements |
1,050,540 |
Suspect/missing elements |
611 |
Data completeness (%) |
99.9 |
/Data_Card_2011_0810/Kersey_70_Ranch_Wind_Shear_Profile_WO_bad_data_600.png)
Vertical Wind Shear, Height (m) vs Mean Wind Speed (m/s)
WITHOUT BAD DATA
|
/Data_Card_2011_0810/Kersey_70_Ranch_Wind_Shear_Profile_600.png)
Vertical Wind Shear, Height (m) vs Mean Wind Speed (m/s)
WITH BAD DATA INCLUDED
|
/Data_Card_2011_0810/Kersey_70_Ranch_Wind_Frequency_Rose_600.png)
Wind Frequency Rose at 33.8 meters
|
/Data_Card_2011_0810/Kersey_70_Ranch_Wind_Energy_Rose_600.png)
Wind Energy Rose at 33.8 meters
|
/Data_Card_2011_0810/Kersey_70_Ranch_Daily_Wind_Speed_Profile_WO_bad_data_600.png)
Daily Wind Speed Profile, Hourly Mean Wind Speed (m/s) vs. Hour of the Day
WITHOUT BAD DATA
|
/Data_Card_2011_0810/Kersey_70_Ranch_Daily_Wind_Speed_Profile_600.png)
Daily Wind Speed Profile, Hourly Mean Wind Speed (m/s) vs. Hour of the Day
WITH BAD DATA INCLUDED
|
/Data_Card_2011_0810/Kersey_70_Ranch_Seasonal_Wind_Speed_Profile_WO_bad_data_600.png)
Seasonal Wind Speed Profile, Monthly Mean Wind Speed (m/s) vs. Month
WITHOUT BAD DATA
|
/Data_Card_2011_0810/Kersey_70_Ranch_Seasonal_Wind_Speed_Profile_600.png)
Seasonal Wind Speed Profile, Monthly Mean Wind Speed (m/s) vs. Month
WITH BAD DATA INCLUDED
|
/Data_Card_2011_0810/Kersey_70_Ranch_PDF_338A_600.png)
Probability Distribution Function at 33.8m - Sensor A: Frequency (%) vs. Wind Speed
|
/Data_Card_2011_0810/Kersey_70_Ranch_PDF_338B_600.png)
Probability Distribution Function at 33.8m - Sensor B: Frequency (%) vs. Wind Speed
|
/Data_Card_2011_0810/Kersey_70_Ranch_PDF_20_WO_bad_data_600.png)
Probability Distribution Function at 20m: Frequency (%) vs. Wind Speed
WITHOUT BAD DATA
|
/Data_Card_2011_0810/Kersey_70_Ranch_PDF_20_600.png)
Probability Distribution Function at 20m: Frequency (%) vs. Wind Speed
WITH BAD DATA INCLUDED |
Windographer was used to match up the wind at this site with the performance curves of some common turbines of various sizes and various heights. The table below shows the results. For the larger turbines, the tower height was increased to account for the larger turbine blades - the wind resource was extrapolated to these higher heights. Keep in mind that the larger and the higher the turbine, the better the wind and the greater the output. But of course, as the tower heights and turbine sizes increase so does the cost.
WITHOUT BAD DATA
Turbine |
Rotor
Diameter
meters |
Rotor
Power
kW |
Hub
Height
meters |
Hub
Height
Wind
Speed
m/s |
Time
At
Zero
Output
percent |
Time
At
Rated
Output
percent |
Average
Net
Power
Output
kW |
Average
Net
Energy
Output
kWh/yr |
Average
Net
Capacity
Factor
% |
Bergey Excel-R |
6.7 |
7.5 |
34 |
4.76 |
37.7 |
3.3 |
1.3 |
11,400 |
17.3 |
Bergey Excel-S |
6.7 |
10 |
34 |
4.76 |
21.5 |
2.0 |
1.4 |
12,600 |
14.4 |
Bergey XL.1 |
2.5 |
1 |
34 |
4.76 |
8.1 |
4.8 |
0.2 |
1,700 |
19.9 |
Southwest Skystream 3.7 |
3.7 |
1.8 |
34 |
4.76 |
35.2 |
0.0 |
0.4 |
3,100 |
19.8 |
Southwest Whisper 500 |
4.5 |
3 |
34 |
4.76 |
37.6 |
4.1 |
0.6 |
5,600 |
21.2 |
Northern Power NW 100/21 |
20 |
100 |
37 |
4.81 |
34.8 |
0.0 |
14.8 |
129,500 |
14.8 |
Vestas V47 - 660 kW |
47 |
660 |
65 |
5.21 |
33.5 |
0.4 |
111.2 |
973,700 |
16.8 |
GE 1.5s |
70.5 |
1,500 |
80.5 |
5.38 |
40.2 |
3.3 |
232.0 |
2,032,300 |
15.5 |
Vestas V80 - 2.0 MW |
80 |
2,000 |
100 |
5.56 |
39.0 |
1.8 |
386.9 |
3,389,500 |
19.3 |
GE 2.5xl |
100 |
2,500 |
110 |
5.65 |
31.8 |
4.3 |
546.4 |
4,786,600 |
21.9 |
WITH BAD DATA INCLUDED
Turbine |
Rotor
Diameter
meters |
Rotor
Power
kW |
Hub
Height
meters |
Hub
Height
Wind
Speed
m/s |
Time
At
Zero
Output
percent |
Time
At
Rated
Output
percent |
Average
Net
Power
Output
kW |
Average
Net
Energy
Output
kWh/yr |
Average
Net
Capacity
Factor
% |
Bergey Excel-R |
6.7 |
7.5 |
34 |
4.73 |
38.2 |
3.3 |
1.3 |
11,400 |
17.3 |
Bergey Excel-S |
6.7 |
10 |
34 |
4.73 |
23.0 |
2.0 |
1.4 |
12,600 |
14.4 |
Bergey XL.1 |
2.5 |
1 |
34 |
4.73 |
9.7 |
4.8 |
0.2 |
1,700 |
19.9 |
Southwest Skystream 3.7 |
3.7 |
1.8 |
34 |
4.73 |
35.9 |
0.0 |
0.4 |
3,100 |
19.8 |
Southwest Whisper 500 |
4.5 |
3 |
34 |
4.73 |
38.1 |
4.1 |
0.6 |
5,600 |
21.2 |
Northern Power NW 100/21 |
20 |
100 |
37 |
4.80 |
35.2 |
0.0 |
14.9 |
130,800 |
14.9 |
Vestas V47 - 660 kW |
47 |
660 |
65 |
5.37 |
32.4 |
0.4 |
120.1 |
1,052,100 |
18.2 |
GE 1.5s |
70.5 |
1,500 |
80.5 |
5.63 |
38.0 |
3.8 |
259.1 |
2,269,800 |
17.3 |
Vestas V80 - 2.0 MW |
80 |
2,000 |
100 |
5.91 |
36.3 |
2.2 |
439.5 |
3,850,400 |
22.0 |
GE 2.5xl |
100 |
2,500 |
110 |
6.04 |
29.7 |
5.3 |
626.2 |
5,485,600 |
25.0 |
IMPORTANT: No turbine losses are included in the power, energy, and capacity factor values in the table. Typically, turbine losses can be 5-20% to account for maintenance downtime, icing/soiling and losses from other turbines in a wind farm. Users wanting to be conservative in the performance projections should multiply the power, energy, and capacity values by (1- % losses) to account for these losses.
|

