HEREFORD - 12/30/2009 to 4/28/2011
LOCATION DETAILS |
Latitude: |
N 40° 59.977’ or N 40° 59’ 59" |
Longitude: |
W 104° 26.163’ or W 104° 26’10" |
Survey Meridian: |
Colorado, Sixth Principal Meridian |
Township: |
12 N |
Range: |
63 W |
Section: |
21 |
Elevation: |
1 675.8 m (5,498 ft) |
Datum: |
WGS 84 |
Tower Type: |
NRG Tilt-Up |
Tower Height: |
30 m (98.4 ft) |
Vane Offset (deg): |
+165° |
Direction Basis: |
Magnetic North |
Mag. Declination: |
8° 56' E, changing by 7' W/yr |
Wind Explorer S/N: |
1378 |
Site No.: |
4040 |
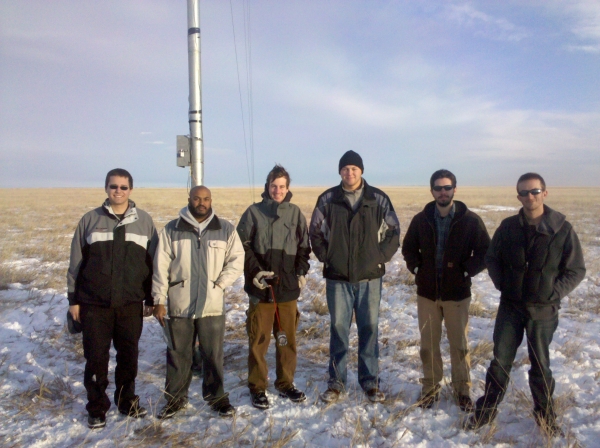
CSU ALP Install Team (from left): Dan Fink, Jake Renquist, Eric Rasbach, Todd Mac Donald, Nathan Davis, and Mike Kostrzewa (taking picture).
DATA DETAILS
December 30, 2009 through April 28, 2011:
The anemometer tower was installed on December 30, 2009 and removed on April 28, 2011. The site is located in Weld County in an open field about 7.2 miles west of Hereford and about 5.6 miles SW of Carpenter, WY. The site is about 20 miles east of the Ponnequin wind farm near Cheyenne and to the east, the turbines from the Cedar Creek wind farm near Grover about 20 miles away can be seen.
All data is collected using an NRG #40 Calibrated Anemometer and NRG #200 Wind Vane mounted on a tilt-up tower located at a height of 30m. The certification for the anemometer is as follows:
NRG #40C Calibrated Anemometer |
Model No. |
1900 |
Serial No. |
179500090563 |
Calibration Date |
12/1/2008 5:23:53 a.m. |
Slope |
0.759 m/s per Hz |
Offset |
0.30 m/s |
This equipment feeds into an NRG Wind Explorer data logger. All data plugs are being collected by the Colorado ALP at Colorado State University for analysis. The data plug files and text versions of these files are given below.
It is important to note that these are the raw files without any compensation for offset. It is also important to note that the temperature was not recorded during this period.
Using this data, an analysis of the wind resource report was developed using Windographer 1.49. For this data an offset of +205° was applied to the wind vane data, based on measurements taken during the installation. However, when the measurements were checked again when the tower was being removed, the offest was measured to be +165°. For this report, a validation analysis was performed on the data. This data was filtered two ways:
- Any wind speed data where the wind speed was less than 1 mph for 6 hours or more was deleted.
- Any wind direction data where the wind direction varied by less than 3 degrees over 6 hours was deleted
Windographer was then used to add in synthetic data to these intervals with suspect data. A summary report, the combined data files (with and without the validation analysis), and the Windographer files (with and without the validation analysis) are given below:
Final Wind Resource Summary
Highlights of the final wind resource at this site are shown below:
Data Properties |
Variable |
Data Set Starts: |
12/30/2009 15:30 MST |
Height above ground (m) |
30 |
Data Set Ends: |
4/28/2011 12:20 |
Mean 10 min avg. wind speed (mph) |
14.989 |
Data Set Duration: |
16 months |
Median 10 min avg. wind speed (mph) |
13.510 |
Length of Time Step: |
10 minutes |
Min 10 min avg. wind speed (mph) |
0.554 |
Elevation: |
1 675.8 m (5,498 ft) |
Max 10 min avg. wind speed (mph) |
56.810 |
Mean air density (kg/m³): |
1.040 |
Mean power density (W/m²) |
329 |
Wind Power Coefficients |
Mean energy content (kWh/m²/yr) |
2,886 |
Power Density at 50m: |
370 W/m² |
Energy pattern factor |
2.105 |
Wind Power Class: |
3 (Fair) |
Weibull k |
1.862 |
Wind Shear Coefficients |
Weibull c (mph) |
16.888 |
Power Law Exponent: |
0.121 |
1-hr autocorrelation coefficient |
0.846 |
Surface Roughness: |
0.01 m |
Diurnal pattern strength |
0.117 |
Roughness Class: |
0.78 |
Hour of peak wind speed |
15 |
Roughness Description: |
Rough Pasture |
Mean turbulence intensity |
0.1393 |
|
Note: The wind power density and wind power class at 50m are projections of the data from 30m. A surface roughness of 0.01 meters was assumed for this projection. This is equal to that of a rough pasture. This value was then used this to calculate the roughness class and the power law exponent shown above. |
Standard deviation (mph) |
8.392 |
Total data elements |
209,031 |
Suspect/missing elements |
6,437 |
Data completeness (%) |
96.9 |
/Data_Plug_2011_0428/Hereford_PDF_600.png)
Probability Distribution Function at 30m: Frequency (%) vs. Wind Speed
|
/Data_Plug_2011_0428/Hereford_Wind_Shear_600.png)
Vertical Wind Shear, Height (m) vs Mean Wind Speed (m/s)
|
/Data_Plug_2011_0428/Hereford_Wind_Energy_Rose_600.png)
Wind Energy Rose at 30 meters
|
/Data_Plug_2011_0428/Hereford_Wind_Frequency_Rose_600.png)
Wind Frequency Rose at 30 meters
|
/Data_Plug_2011_0428/Hereford_Daily_Wind_Speed_Profile_600.png)
Daily Wind Speed Profile, Hourly Mean Wind Speed (m/s) vs. Hour of the Day
|
/Data_Plug_2011_0428/Hereford_Seasonal_Wind_Speed_Profile_600.png)
Seasonal Wind Speed Profile, Monthly Mean Wind Speed (m/s) vs. Month
|
Windographer was used to match up the wind at this site with the performance curves of some common turbines of various sizes and various heights. The table below shows the results. For the larger turbines, the tower height was increased to account for the larger turbine blades - the wind resource was extrapolated to these higher heights. Keep in mind that the larger and the higher the turbine, the better the wind and the greater the output. But of course, as the tower heights and turbine sizes increase so does the cost.
|
|
|
|
Hub
Height
Wind
Speed
mph
|
Time
At
Zero
Output
percent
|
Time
At
Rated
Output
percent
|
Average
Net
Power
Output
kW
|
Average
Net
Energy
Output
kWh/yr
|
Average
Net
Capacity
Factor
%
|
|
|
|
30 |
14.99 |
16.1 |
7.6 |
2.3 |
20,500 |
31.1 |
|
|
|
30 |
14.99 |
7.3 |
4.9 |
2.7 |
23,300 |
26.6 |
|
|
|
30 |
14.99 |
2.6 |
11.5 |
0.4 |
3,100 |
35.8 |
|
|
|
30 |
14.99 |
14.1 |
0.0 |
0.6 |
5,400 |
34.3 |
|
|
|
30 |
14.99 |
15.8 |
9.5 |
1.1 |
9,800 |
37.2 |
|
|
|
37 |
15.37 |
13.4 |
0.0 |
27.3 |
238,900 |
27.3 |
|
|
|
65 |
16.46 |
12.8 |
2.1 |
203.8 |
1,785,600 |
30.9 |
|
|
|
80.5 |
16.89 |
17.0 |
9.0 |
429.2 |
3,759,400 |
28.6 |
|
|
|
100 |
17.34 |
16.3 |
5.5 |
667.9 |
5,850,800 |
33.4 |
|
|
|
110 |
17.54 |
11.5 |
10.4 |
920.5 |
8,063,800 |
36.8 |
IMPORTANT: No turbine losses are included in the power, energy, and capacity factor values in the table. Typically, turbine losses can be 5-20% to account for maintenance downtime, icing/soiling and losses from other turbines in a wind farm. Users wanting to be conservative in the performance projections should multiply the power, energy, and capacity values by (1- % losses) to account for these losses.
|

