RIDGWAY - 9/12/2009 to 7/27/2010
LOCATION DETAILS |
Latitude: |
N 38° 8.909’ or N 38° 8’54" |
Longitude: |
W 107° 44.854’ or W 107° 44’ 51" |
Township: |
45 N |
Range: |
8 W |
Section: |
16 |
Elevation (ft.): |
6,986 |
Datum: |
WGS 84 |
Tower Type: |
NRG Tilt-Up |
Tower Height: |
20 m (65.6 ft) |
Vane Offset (deg): |
+328° |
Direction Basis: |
Magnetic North |
Mag. Declination: |
10° 16' E, changing by 7' W/yr |
Wind Explorer S/N: |
0665 |
Site No.: |
3807 |
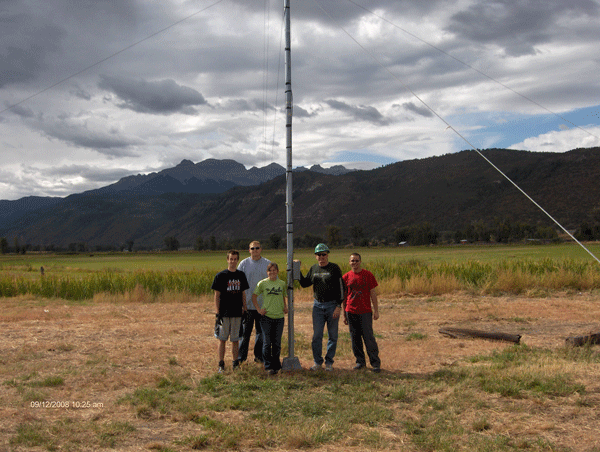
CSU ALP Install Team (from left): Eric Rasbach, Todd MacDonald, Nikki Dunlap, Mike Kostrzewa, Daniel Fink, and Will Clapsadl (taking picture).
DATA DETAILS
September 12, 2009 to July 27, 2010:
The anemometer tower was installed on September 12, 2009 and removed July 27, 2010 due to the poor wind resource. The site was located on the southern end of the Ouray County fairgrounds, just east of U.S. Hwy 550. This site was located in a valley floor, with mesas and mountains on all sides. Winds were expected to come down the valley from Ouray, which is southeast of the site. The winds were expected to be strong and at times violent from this direction.
All data was collected using an NRG #40 Calibrated Anemometer and NRG #200 Wind Vane mounted on a tilt-up tower located at a height of 20m. The certification for the anemometer is as follows:
NRG #40C Calibrated Anemometer |
Model No. |
1900 |
Serial No. |
179500087809 |
Calibration Date |
10/31/2009 5:48:36 a.m. |
Slope |
0.756 m/s per Hz |
Offset |
0.37 m/s |
This equipment fed into an NRG Wind Explorer data logger. All data plugs were sent to the Colorado ALP at Colorado State University for analysis. The data plug files and text versions of these files are given below.
It is important to note that these are the raw files without any compensation for offset. It is also important to note that the temperature was not recorded during this period.
Using this data, an analysis of the wind resource report was developed using Windographer 1.45. For this data an offset of +328° was applied to the wind vane data. For this report, a validation analysis was performed on the data. This data was filtered two ways:
- Any wind speed data where the wind speed was less than 1 mph for 6 hours or more was deleted.
- Any wind direction data where the wind direction varied by less than 3 degrees over 6 hours was deleted
Windographer was then used to add in synthetic data to these intervals with suspect data. The combined data files (with and without the validation analysis), and the Windographer files (with and without the validation analysis) are given below:
Final Wind Resource Summary
The anemometer tower was removed from the site on July 27, 2010. Highlights of the wind resource at this site for the entire monitoring period are shown below:
Data Properties |
Variable |
Data Set Starts: |
9/12/2009 09:20 MST |
Height above ground (m) |
20 |
Data Set Ends: |
7/27/2010 12:10 |
Mean 10 min avg. wind speed (mph) |
5.038 |
Data Set Duration: |
10.5 months |
Median 10 min avg. wind speed (mph) |
2.310 |
Length of Time Step: |
10 minutes |
Min 10 min avg. wind speed (mph) |
0.105 |
Elevation (ft.): |
6,986 |
Max 10 min avg. wind speed (mph) |
39.67 |
Mean air density (kg/m³): |
0.994 |
Mean power density (W/m²) |
39 |
Wind Power Coefficients |
Mean energy content (kWh/m²/yr) |
346 |
Power Density at 50m: |
57 W/m² |
Energy pattern factor |
6.952 |
Wind Power Class: |
1 (Poor) |
Weibull k |
0.939 |
Wind Shear Coefficients |
Weibull c (mph) |
4.879 |
Power Law Exponent: |
0.126 |
1-hr autocorrelation coefficient |
0.769 |
Surface Roughness: |
0.0101 m |
Diurnal pattern strength |
0.673 |
Roughness Class: |
0.78 |
Hour of peak wind speed |
15 |
Roughness Description: |
Rough Pasture |
Mean turbulence intensity |
0.2901 |
|
Note: The wind power density and wind power class at 50m are projections of the data from 20m. A surface roughness of 0.01 meters was assumed for this projection.. This is the surface roughness for a rough pasture. This value was then used this to calculate the roughness class and the power law exponent shown above. |
Standard deviation (mph) |
5.605 |
Total data elements |
137,343 |
Suspect/missing elements |
5,463 |
Data completeness (%) |
96.0 |
Windographer was used to match up the wind at this site with the performance curves of some common turbines of various sizes and various heights. The table below shows the results. For the larger turbines, the tower height was increased to account for the larger turbine blades - the wind resource was extrapolated to these higher heights. Keep in mind that the larger and the higher the turbine, the better the wind and the greater the output. But of course, as the tower heights and turbine sizes increase so does the cost
Turbine |
Rotor
Diameter
meters |
Rotor
Power
kW |
Hub
Height
meters |
Hub
Height
Wind
Speed
mph |
Time
At
Zero
Output
percent |
Time
At
Rated
Output
percent |
Average
Net
Power
Output
kW |
Average
Net
Energy
Output
kWh/yr |
Average
Net
Capacity
Factor
% |
Bergey Excel-R |
6.7 |
7.5 |
20 |
5.04 |
73.34 |
0.47 |
0.4 |
3,400 |
5.2 |
Bergey Excel-S |
6.7 |
10 |
20 |
5.04 |
64.94 |
0.16 |
0.4 |
3,700 |
4.2 |
Bergey XL.1 |
2.5 |
1 |
20 |
5.04 |
51.68 |
0.66 |
0.1 |
500 |
6.0 |
Southwest Skystream 3.7 |
3.7 |
1.8 |
20 |
5.04 |
71.85 |
0 |
0.1 |
1,000 |
6.4 |
Southwest Whisper 500 |
4.5 |
3 |
20 |
5.04 |
73.34 |
0.57 |
0.2 |
1,800 |
6.8 |
Northern Power NW 100/21 |
21 |
100 |
37 |
5.44 |
70.10 |
0 |
4.4 |
38,600 |
4.4 |
Vestas V47 - 660 kW |
47 |
660 |
65 |
5.94 |
69.54 |
0.03 |
39.8 |
348,800 |
6.0 |
GE 1.5s |
70.5 |
1,500 |
80.5 |
6.12 |
72.53 |
0.63 |
77.3 |
677,300 |
5.2 |
Vestas V80 - 2.0 MW |
80 |
2,000 |
100 |
6.31 |
71.85 |
0.26 |
137.7 |
1,205,900 |
6.9 |
GE 2.5xl |
100 |
2,500 |
110 |
6.40 |
68.31 |
0.87 |
196.5 |
1,721,700 |
7.9 |
IMPORTANT: No turbine losses are included in the power, energy, and capacity factor values in the table. Typically, turbine losses can be 5-20% to account for maintenance downtime, icing/soiling and losses from other turbines in a wind farm. Users wanting to be conservative in the performance projections should multiply the power, energy, and capacity values by (1- % losses) to account for these losses.
|


/Data_Plug_2010_0727/Ridgway_PDF_600.png)
/Data_Plug_2010_0727/Ridgway_Wind_Shear_Profile_300.png)
/Data_Plug_2010_0727/Ridgway_Wind_Rose_300.png)
/Data_Plug_2010_0727/Ridgway_Seasonal_Wind_Speed_Profile_300.png)
/Data_Plug_2010_0727/Ridgway_Daily_Wind_Speed_Profile_300.png)